There are many different tools used in usability testing but what do they each measure, which should you use and how should you use them? Here’s our guide to 12 tools that will help you accurately measure how your website preforms against various usability criteria.
(By the way, none of these are paid reviews.)
1. Tools for task analysis (how easy it is to complete a task)
Intuition HQ is a task analysis tool which asks participants complete certain tasks on your website. Data on how long each process task takes, where participants click to complete the task as well as feedback are available to you.
Step 1: Sign up.
Step 2: Set up a test. Think about tasks that you want your visitors to complete and set these up in Intuition HQ.
Step 3: Go live with your test. Intuition HQ will provide you with a link to each test to share the link to get participants to take your test.
Step 4: The results. At any point you can access a report detailing how long it took participants to complete a task, where they clicked and how many times.
Pricing: The free account allows you to conduct 10 live tests, with an unlimited number of questions and 350 participants.
Loop11
Loop11 allows you to set up usability tests without an in depth knowledge of code. It provides you with figures showing how many visitors successfully complete, fail to complete or abandon a task.
Step 1: Sign up.
Step 2: Create tasks and ask visitors questions about those tasks.
Step 3: Customise the look of your test.
Step 4: Promote your test url to get participants to take part.
Visitors will see an introduction page, optional instructions, then the task is given in a task bar across the top of the website, with a complete or abandon button.
Pricing: This tool is a little more costly, you can pay monthly or $350 per project.
UserTesting
The difference between this tool and the two above tools is that UserTesting will recruit the participants for you. These testers are paid to review your website according to the tasks and questions you set. Another unique point is that the process is recorded and narrated by the testers - usually these videos are available within an hour or so of setting up the test! (You also receive a written summary.)
Step 1: Select your target audience.
Step 2: Add your URL and instructions on the 'mindset' that participants should have.
Step 3: Then add tasks and post-test questions for the participants.
Step 4: Review the test, sign up and pay.
Pricing: You pay $49 per participant and there is a first order $49 discount if your order is over $100.
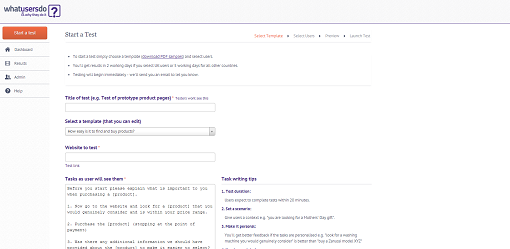
Whatusersdo
This tool is similar to UserTesting in that the end result is a video of a tester completing and commenting on tasks that you have set. Whatusersdo is slightly cheaper than UserTesting but offers fewer options.
Step 1: Sign up.
Step 2: Select a template test and edit it to fit your website.
Step 3: Select the the age and gender of testers.
Step 4: Preview the test and pay.
Pricing: £30 per user test.
2. Tools to measure site navigation
Treejack
This tool is all about measuring and fine tuning your website's structure. It allows you to ask paticipants how they would go about finding something using your website structure.
Participants taking a test are presented with a welcome screen with your logo and colours, then with a page of instructions. Next, they’re given a task and a menu to choose from by clicking ‘I’d find it here’.
Step 1: Sign up.
Step 2: Input your website menu tree.
Step 3: Set tasks.
Step 4: Recruit participants. You can email a link, promote on social media or get help from TreeJack in finding participants.
Pricing: Flat rate of $109 per month.
3. Tools to test page load speed on mobile devices and desktop
PageSpeed Insights from Google
Page load speed is one of the most important factors when it comes to making your website accessible to mobile devices.
PageSpeed Insights analyses your page for both mobile and desktop load speed, giving it a score out of 100. Details of fixes needed to improve load speed are given and prioritised as ‘Should Fix’ or ‘Consider Fixing’.
Step 1: Enter the URL you would like to test.
Step 2: See the results.
Pricing: It’s completely free.
Other tools include:
Pingdom Tools – Measures website response time and webpage size.
4. Tools to measure how learn-able your website is
FiveSecondTest
This tool ties down what participants can learn from your website in 5 seconds. People are busy. They decide in seconds whether or not they think your website can help them. So you only have a short window of opportunity to get your message across.
The Five Second Test starts with two lines of instructions for the user. A task or some context is given to the user then, when they’re ready; they’re shown an image for 5 seconds and quizzed on what they saw.
Step 1: Sign up.
Step 2: Upload print screens to test.
Step 3: Set questions that you would like users to answer.
Step 4: Invite people to take your test. Test responses will also come from UsabilityHub members.
Step 5: View your results.
Pricing: Prices range from $20 per month to $200 per month depending on the number of responses that you would like to collect. All plans work out at $0.20 per response.
5. Tools to measure user satisfaction
Usabilla
Usabilla provides you with functionality allowing your visitors to leave feedback on your website from any device. Feedback forms can be fully customized and additional features are available, which include a slide out panel encouraging visitors to leave reviews, exit surveys, and slide out polls. You can choose when and how these are displayed.
Step 1: Sign up.
Step 2: Create a feedback button.
Step 3: Copy feedback button code into the HTML code of your website.
Step 4: Customise your feedback button.
Step 5: Set up other features such as a slide out panel personally asking visitors to leave reviews, exit surveys, and slide out polls.
Step 6: The results: a dashboard gives you live data.
Pricing: A free 14 day trial is available. After that pricing ranges from $49 per month (less than 100,000 page views per month) to $199 per month (up to 500,000 page views per month).
Feedback Army
This is probably the quickest and easiest of all these applications to set up but its scope is limited. If you are looking for a thorough analysis of your website, this is not what you need. However, if you're looking for yes / no answers to a couple of specific questions, Feedback Army will do the job on a budget.
Step 1: Choose 4 to 6 questions to ask reviewers
Step 2: Preview your test and complete the purchase.
Step 3: See your feedback.
Pricing: Starts at 10 responses for $40 and goes up to 50 responses for $150.
6. Tools for A/B Testing
A/B testing is simply where variations of a webpage are alternated between visitors and data on the behaviour of these visitors is compared to ascertain which page converts at a higher rate.
Google Analytics Content Experiments
In Google Analytics Content Experiments you can set up experiments comparing up to 5 different variations of a page to see which preforms better against criteria you set up.
Step 1: Go to the experiments section of your Google Analytics account. Reporting > Content > Experiments > Start Experimenting.
Step 2: Choose your objectives.
Step 3: Identify your original and variation pages.
Step 4: Add the experiment code to your website and check it’s working.
Step 5: Review and start your experiment.
Step 6: Make any tweaks and changes.
Pricing: Free.
Convert
Convert has an easy to use visual tool which allows you to create variations of a webpage to test in A/B tests. It's actually an extension of Google Analytics Experiments and integrates the A/B test results into your account as custom variables.
Step 1: Enter your URL.
Step 2. Edit element of the page to make unique variations of the page.
Step 3. Place a Java code snippet into the HTML header of your webpage.
Step 4. Review the results in your Google Analytics account.
Pricing: Starts from $9 per month and ranges to $99 per month depending on your requirements, you can also trial the product for 15 days.
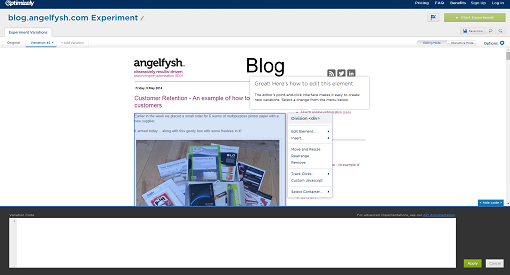
Optimizley
Similar to Convert, Optimizely helps you create multiple variations of a page, and track how these variations perform. You can easily reword copy and move, resize or change the formatting of elements. Then you can test the page variations against each other to see which converts better.
Step 1: Enter your URL.
Step 2. Edit elements of the page to make unique variations of the page.
Step 3. Create goals, e.g. how many people click the 'Add to Cart' button.
Step 4. Choose your audience, e.g. returning visitors.
Step 5. Place a Java code snippet into the HTML header of your webpage.
Step 6. Launch the A/B test and watch the results.
Pricing: Starts from £12 per month and ranges to £243 per month, but a free 30 day trial is available so you can try before you buy.
Crazy Egg
Crazy Egg is a heat map tool that allows you to see where visitors are clicking and how they scroll over certain page. This information shows you where users want your website to be clickable. You can also see who clicks what, as the data can be broken down showing where different referral visitors clicked. It's easy to compare two different page designs at a time to give you further insight into A/B testing.
Step 1: Sign up.
Step 2: Tell Crazy Egg which page you want to track.
Step 3: Start viewing the data.
Pricing: Starts a $9 per month and is billed annually.
We hope this article has been useful in helping you decide which usability tests you should use to measure and improve conversion on your website. If you've got any other usability test resources to recommend, please add them in a comment below.